
How PMOs really perform, country by country.
Evidence-based reports built on PMO-MI® assessments across 24 service domains, calibrated against independent assessor-led reviews and compared internationally.
Free for registered readers · Read online · Accounts are reviewed before access
One model for the PMO.
Measured service by service.
PMO-MI® (Project Management Office Maturity and Impact) assesses the services a PMO provides, from governance and portfolio management to benefits, change and innovation. Each of the 24 service domains is rated through five questions, and the overall score places an office on a five-level maturity scale.
- 1Fragmentedbelow 2.0Reactive, ad hoc services; little process or strategic alignment.
- 2Developing2.0–2.99Defined processes forming; demand starts to be managed systematically.
- 3Converged3.0–3.99Documented, consistent practices; demand managed proactively.
- 4Integrated4.0–4.99Strategic, efficient services; demand built into business planning.
- 5Synergized5.0The PMO pioneers innovation and drives organizational strategy.
From self-assessment
to calibrated evidence.
Self-assessments are a fast way to see a whole country, but leaders tend to rate their own office generously. PMO-MI® reports correct for that before drawing conclusions.

PMO leaders rate their office on all 24 service domains with the free PMO-MI® Tier 1 questionnaire.
Assessor-led Tier 2 assessments of the same offices show how far self-ratings drift, so scores are adjusted before they are compared.
Results are set against PMO-MI® assessments from other countries, sectors and portfolio types.
Each report closes with practical priorities for PMO leaders, executives and national bodies.

Strengthening City of Cape Town’s PMOs
Assessment Findings and National Insights
Prepared for the City of Cape Town, with insights for metropolitan municipalities and public- and private-sector organisations across South Africa. 41 assessments of 25 management offices, calibrated with 10 independent assessor-led reviews and compared with 129 assessments from 14 other countries.
- 01Key findings and executive summary
- 02Why management office maturity and impact matter for South Africa
- 03Who took part
- 04Self-assessment and calibration
- 05Overall maturity and international comparison
- 06All 24 service domains, one by one
- 07Common themes across offices
- 08Leadership, influence and AI
- 09Challenges reported by respondents
- 10Implications and five recommendations
- 11Appendices: methodology, domain reference, calibration, national savings scenarios
Research partners: Stellenbosch University and Alma Mater Europaea University.
Snapshots from the report.
The full analysis is inside.
Self-ratings sit well above calibrated scores
In all 10 offices assessed both ways, independent ratings came out lower, by a median of 1.40 points.
Where the 41 assessments fall
Fragmented41%
Developing56%
Converged2%
Integrated0%
Synergized0%
Strongest and weakest services
- Financial Management2.23
- Stakeholder Management2.22
- Governance2.20
- Configuration Management1.85
- Innovation Management1.81
- Capability and Capacity Management1.75
All 24 domains, with question-level results, are in the full report.
Register to readAhead of 14 other countries
- South Africa41 assessments1.98
- Other countries129 assessments1.62
Infrastructure offices score lowest
- Regulatory & compliancen = 52.45
- Mixed portfoliosn = 142.09
- Capital & infrastructuren = 181.81
Source: PMO-MI® Tier 1 assessments, participating South African sample (n = 41); calibration informed by assessor-led assessments. Scores describe the participating sample, not national estimates.
What the South Africa
assessments revealed.
Each finding is developed in the report with the evidence behind it, and linked to five recommendations for PMO leaders and executives.
Independent assessor-led ratings came out lower in all ten paired offices, by a median of 1.40 points.
1.98 against 1.62 across 129 assessments from 14 other countries, on the same calibration.
Capability and capacity, and innovation, are the weakest of the 24 service domains.
Multi-office coordination trails strategic coherence in 22 of the 24 domains.
1.81 against 2.09 for mixed portfolios and 2.45 for regulatory and compliance offices.
More mature offices assess new requests, choose suppliers and reuse knowledge more consistently.
One report out.
More countries on the way.
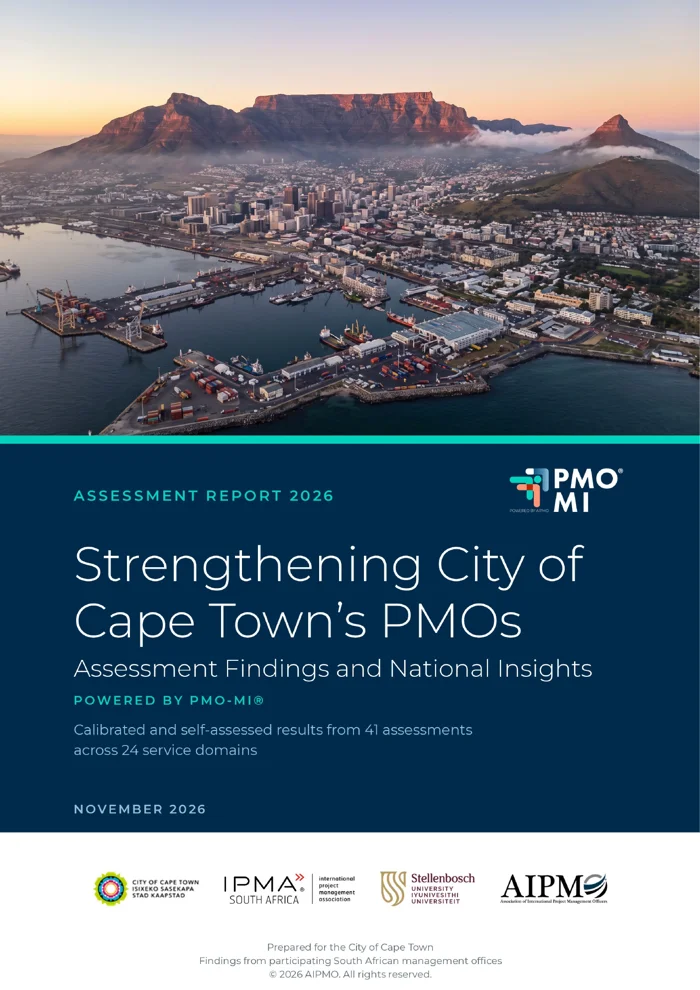
Strengthening City of Cape Town’s PMOs: Assessment Findings and National Insights.
Based on PMO-MI® assessments from German organisations. Release date to be announced.
Based on PMO-MI® assessments from Brazilian organisations. Release date to be announced.
The free PMO-MI® Tier 1 assessment takes about 20 minutes. You get your own baseline across the 24 domains, and your anonymised answers strengthen the next country report.

Register once. Read every PMO-MI® report.
Create a free reader account. Once our team has approved it, you can read the reports online.
Register to read